Audit report template
A security assessment report in one HTML file – executive summary with severity counts, scope and method, findings with evidence and fixes, a 30-day plan, and an appendix. Duplicate it, or hand the prompt to your agent.
Template
An agency campaign recap in one HTML page – the headline result, the numbers that matter, a weekly chart, a channel table, what worked, what did not, next bets, and budget versus spend. Duplicate it, or hand the prompt to your agent.
Publishing this from your own stack? See Display for AI reports.
Preview
campaign-recap.html<!doctype html>
<!-- Template: Campaign recap. Replace the sample content and keep the structure. Sections: Header and metadata, Headline result, Key numbers, Weekly chart, Channel table, What worked, What did not, Learnings, Next bets, Budget against spend, Notes on the numbers. -->
<html lang="en">
<head>
<meta charset="utf-8">
<meta name="viewport" content="width=device-width, initial-scale=1">
<meta name="color-scheme" content="light">
<title>Autumn 2026 campaign recap – Marlow Coffee</title>
<meta name="description" content="Oaken & Pike recap of the eight-week Slow Mornings campaign for Marlow Coffee: results, spend by channel, what worked, what did not, and next bets.">
<link rel="preconnect" href="https://fonts.googleapis.com">
<link rel="preconnect" href="https://fonts.gstatic.com" crossorigin>
<link href="https://fonts.googleapis.com/css2?family=Archivo+Black&family=Archivo:wght@400;500;600&display=swap" rel="stylesheet">
<style>
:root {
--bg: oklch(0.972 0.013 78);
--ink: oklch(0.18 0.01 60);
--muted: oklch(0.46 0.018 65);
--line: oklch(0.82 0.015 75);
--accent: oklch(0.6 0.2 30);
--accent-deep: oklch(0.5 0.19 30);
--display: 'Archivo Black', 'Archivo', ui-sans-serif, sans-serif;
--text: 'Archivo', ui-sans-serif, sans-serif;
--measure: 50rem;
}
* { box-sizing: border-box; }
html { background: var(--bg); color: var(--ink); -webkit-text-size-adjust: 100%; }
body {
margin: 0;
font-family: 'Archivo', ui-sans-serif, sans-serif;
font-size: 1.0625rem;
line-height: 1.5;
font-variant-numeric: tabular-nums;
background: var(--bg);
color: var(--ink);
}
.page { max-width: 76rem; margin: 0 auto; padding: 0 clamp(1rem, 4vw, 3rem) 3rem; }
p { margin: 0 0 1rem; }
strong { font-weight: 600; }
.visually-hidden { position: absolute; width: 1px; height: 1px; overflow: hidden; clip: rect(0 0 0 0); white-space: nowrap; }
.label {
font-size: .75rem;
font-weight: 600;
text-transform: uppercase;
letter-spacing: .08em;
color: var(--muted);
}
/* Header */
.strip {
display: flex;
justify-content: space-between;
align-items: baseline;
flex-wrap: wrap;
gap: .5rem 2rem;
padding: 1.25rem 0 .75rem;
border-bottom: 1px solid var(--ink);
}
.wordmark { font-family: var(--display); font-size: 1.125rem; letter-spacing: -0.01em; }
.wordmark .amp { color: var(--accent-deep); }
h1 {
font-family: var(--display);
font-weight: 400;
font-size: clamp(2.1rem, 5.6vw, 4.75rem);
line-height: .98;
letter-spacing: -0.02em;
margin: 1.5rem 0 1rem;
}
h1 .h1-b { display: block; font-family: var(--text); font-weight: 500; letter-spacing: -0.01em; }
.sub { max-width: 38rem; font-size: 1.125rem; line-height: 1.45; margin: 0; }
.meta {
display: grid;
grid-template-columns: repeat(auto-fit, minmax(11rem, 1fr));
gap: .9rem 2rem;
margin: 1.75rem 0 0;
padding: 1rem 0 0;
border-top: 1px solid var(--ink);
}
.meta div { margin: 0; }
.meta dt { font-size: .75rem; font-weight: 600; text-transform: uppercase; letter-spacing: .08em; color: var(--muted); }
.meta dd { margin: .15rem 0 0; font-weight: 500; font-size: .9375rem; line-height: 1.4; }
/* Headline result */
.headline {
display: grid;
grid-template-columns: auto minmax(0, 1fr);
column-gap: 3rem;
align-items: end;
padding: 2rem 0 2.5rem;
}
.headline > * { min-width: 0; }
.big-num {
display: block;
font-family: var(--display);
font-size: clamp(5.5rem, 17vw, 15rem);
line-height: .82;
letter-spacing: -0.03em;
color: var(--accent);
margin: 0;
}
.big-text { max-width: 30rem; padding-bottom: .35rem; }
.big-lead {
font-family: var(--display);
font-size: clamp(1.4rem, 2.4vw, 2rem);
line-height: 1.1;
letter-spacing: -0.01em;
margin: 0 0 .9rem;
}
.big-text p:last-child { margin-bottom: 0; }
/* Sections */
.section {
display: grid;
grid-template-columns: minmax(0, 15rem) minmax(0, 1fr);
column-gap: 4rem;
row-gap: 1.25rem;
border-top: 3px solid var(--ink);
padding: 1rem 0 2.5rem;
}
.section > * { min-width: 0; }
.section > h2 {
grid-column: 1;
margin: 0;
font-family: var(--display);
font-weight: 400;
font-size: clamp(1.3rem, 2vw, 1.7rem);
line-height: 1.1;
letter-spacing: -0.01em;
}
.section > .body { grid-column: 2; max-width: var(--measure); }
.section > .body.grow { max-width: none; }
.section > .wide { grid-column: 1 / -1; }
.section > .body > :last-child { margin-bottom: 0; }
/* Key numbers */
.nums {
display: grid;
grid-template-columns: repeat(3, minmax(0, 1fr));
gap: 2rem 2.5rem;
}
.num { border-top: 2px solid var(--ink); padding-top: .7rem; }
.num-value {
display: block;
font-family: var(--display);
font-size: clamp(2.4rem, 5vw, 4.5rem);
line-height: 1;
letter-spacing: -0.02em;
margin: .4rem 0 .55rem;
}
.num-base { display: block; color: var(--muted); font-size: .9375rem; line-height: 1.4; }
.delta { color: var(--accent-deep); font-weight: 600; white-space: nowrap; }
/* Chart */
.chart { margin: 0; }
.chart svg { display: block; width: 100%; max-width: 60rem; height: auto; }
.c-grid line { stroke: var(--line); stroke-width: 1; }
.c-base { stroke: var(--ink); stroke-width: 2; }
.c-bars rect { fill: var(--ink); }
.c-bars rect.hi { fill: var(--accent); }
.c-spring { stroke: var(--ink); stroke-width: 1.5; stroke-dasharray: 5 4; }
.c-legend line { stroke: var(--ink); stroke-width: 1.5; stroke-dasharray: 5 4; }
.c-legend text { fill: var(--muted); font: 500 12px/1 'Archivo', ui-sans-serif, sans-serif; }
.c-axis text { fill: var(--muted); font: 500 12px/1 'Archivo', ui-sans-serif, sans-serif; text-anchor: end; }
.c-val text { fill: var(--ink); font: 600 13px/1 'Archivo', ui-sans-serif, sans-serif; text-anchor: middle; paint-order: stroke fill; stroke: var(--bg); stroke-width: 4px; stroke-linejoin: round; }
.c-val text.hi { fill: var(--accent-deep); }
.c-week text { fill: var(--ink); font: 600 13px/1 'Archivo', ui-sans-serif, sans-serif; text-anchor: middle; }
.c-date text { fill: var(--muted); font: 500 12px/1 'Archivo', ui-sans-serif, sans-serif; text-anchor: middle; }
.c-note rect { fill: var(--bg); }
.c-note line { stroke: var(--ink); stroke-width: 1; }
.c-note text { fill: var(--ink); font: 500 12px/1 'Archivo', ui-sans-serif, sans-serif; }
.c-note text.hi { fill: var(--accent-deep); font-weight: 600; }
figcaption { font-size: .9375rem; line-height: 1.5; color: var(--muted); max-width: var(--measure); margin: 1rem 0 0; }
figcaption strong { color: var(--ink); }
/* Tables */
.table-scroll { position: relative; overflow-x: auto; -webkit-overflow-scrolling: touch; }
table { width: 100%; border-collapse: collapse; font-size: .9375rem; line-height: 1.4; min-width: 42rem; }
caption { text-align: left; caption-side: top; font-size: .875rem; font-weight: 600; padding: 0 0 .6rem; }
th, td { text-align: left; padding: .65rem .9rem .65rem 0; border-bottom: 1px solid var(--line); vertical-align: top; }
th:last-child, td:last-child { padding-right: 0; }
thead th {
font-size: .75rem;
font-weight: 600;
text-transform: uppercase;
letter-spacing: .04em;
color: var(--muted);
border-bottom: 2px solid var(--ink);
vertical-align: bottom;
}
tbody th { font-weight: 600; }
td.n, th.n { text-align: right; white-space: nowrap; }
td.why { min-width: 16rem; color: var(--muted); }
td.txt { min-width: 14rem; }
table:has(tfoot) tbody tr:last-child > * { border-bottom: 0; }
tfoot th, tfoot td { border-top: 2px solid var(--ink); border-bottom: 0; font-weight: 600; }
.table-note { font-size: .8125rem; line-height: 1.5; color: var(--muted); max-width: var(--measure); margin: .9rem 0 0; }
/* Lists */
.points { list-style: none; margin: 0; padding: 0; counter-reset: pt; }
.points > li {
counter-increment: pt;
display: grid;
grid-template-columns: 3rem minmax(0, 1fr);
column-gap: 1.25rem;
padding: .9rem 0;
border-top: 1px solid var(--line);
}
.points > li:first-child { border-top: 0; padding-top: 0; }
.points > li:last-child { padding-bottom: 0; }
.points > li::before {
content: counter(pt);
font-family: var(--display);
font-size: 1.75rem;
line-height: 1;
color: var(--accent);
}
.points h3 { font-family: var(--text); font-size: 1.0625rem; font-weight: 600; margin: 0 0 .3rem; line-height: 1.4; }
.points p:last-child { margin-bottom: 0; }
.learn { margin: 0; padding: 0; list-style: none; }
.learn li { padding: .85rem 0; border-top: 1px solid var(--line); }
.learn li:first-child { border-top: 0; padding-top: 0; }
.learn strong { display: block; margin-bottom: .15rem; }
.notes { margin: 0; padding: 0; list-style: none; font-size: .9375rem; color: var(--muted); }
.notes li { padding: .5rem 0; border-top: 1px solid var(--line); }
.notes li:first-child { border-top: 0; padding-top: 0; }
.notes strong { color: var(--ink); }
/* Footer */
.foot {
display: flex;
flex-wrap: wrap;
justify-content: space-between;
gap: .4rem 2rem;
border-top: 3px solid var(--ink);
padding-top: 1rem;
font-size: .8125rem;
color: var(--muted);
}
.foot .wordmark { font-size: .9375rem; color: var(--ink); }
@media (min-width: 861px) {
.learn, .notes { display: grid; grid-template-columns: repeat(2, minmax(0, 1fr)); column-gap: 3rem; }
.learn li:nth-child(-n+2), .notes li:nth-child(-n+2) { border-top: 0; padding-top: 0; }
}
@media (max-width: 860px) {
.section { grid-template-columns: minmax(0, 1fr); row-gap: 1rem; padding-bottom: 2.5rem; }
.section > .body, .section > .wide { grid-column: 1; }
.headline { grid-template-columns: minmax(0, 1fr); row-gap: 1.25rem; padding: 2rem 0 2.5rem; }
.big-text { padding-bottom: 0; }
}
@media (max-width: 600px) {
.nums { grid-template-columns: repeat(2, minmax(0, 1fr)); gap: 1.5rem 1.25rem; }
.c-axis text, .c-legend text, .c-date text { font-size: 20px; }
.c-val text, .c-week text { font-size: 22px; }
.c-note { display: none; }
}
</style>
</head>
<body>
<div class="page">
<header>
<div class="strip">
<span class="wordmark">Oaken <span class="amp">&</span> Pike</span>
<span class="label">Campaign recap · Autumn 2026</span>
</div>
<h1><span class="h1-a">Autumn campaign recap</span> <span class="h1-b">Marlow Coffee</span></h1>
<p class="sub">Eight weeks of “Slow Mornings”, 1 September – 26 October 2026, in one document: the result, where the money went, what missed, and the three bets we would make next.</p>
<dl class="meta">
<div><dt>Client</dt><dd>Marlow Coffee</dd></div>
<div><dt>Campaign</dt><dd>“Slow Mornings”, autumn 2026</dd></div>
<div><dt>Period</dt><dd>8 weeks, 1 Sep – 26 Oct 2026</dd></div>
<div><dt>Prepared by</dt><dd>Oaken & Pike · Ines Varga, account lead · Tobias Renn, performance</dd></div>
<div><dt>Issued</dt><dd>3 November 2026 · Version 1.0</dd></div>
</dl>
</header>
<section class="headline" aria-labelledby="headline-h">
<h2 id="headline-h" class="visually-hidden">The headline result</h2>
<p class="big-num">+42%</p>
<div class="big-text">
<p class="big-lead">click-through against the spring campaign.</p>
<p>3.1% of the people who saw the work clicked, against 2.2% in March–April. The campaign came in €2,000 under its €120,000 budget, reached 2.4 million people and brought 8,310 new customers at €14.20 each, 22% cheaper than in spring.</p>
</div>
</section>
<section class="section" aria-labelledby="numbers-h">
<h2 id="numbers-h">The numbers that matter</h2>
<div class="nums wide">
<div class="num">
<span class="label">Spend</span>
<span class="num-value">€118k</span>
<span class="num-base">of the €120k budget · <span class="delta">98% used</span></span>
</div>
<div class="num">
<span class="label">Reach</span>
<span class="num-value">2.4M</span>
<span class="num-base">people · 1.9M in spring · <span class="delta"><span aria-hidden="true">▲</span><span class="visually-hidden">up</span> 26%</span></span>
</div>
<div class="num">
<span class="label">Click-through</span>
<span class="num-value">3.1%</span>
<span class="num-base">2.2% in spring · <span class="delta"><span aria-hidden="true">▲</span><span class="visually-hidden">up</span> 42%</span></span>
</div>
<div class="num">
<span class="label">Cost per customer</span>
<span class="num-value">€14.20</span>
<span class="num-base">€18.20 in spring · <span class="delta"><span aria-hidden="true">▼</span><span class="visually-hidden">down</span> 22%</span></span>
</div>
<div class="num">
<span class="label">New customers</span>
<span class="num-value">8,310</span>
<span class="num-base">6,040 in spring · <span class="delta"><span aria-hidden="true">▲</span><span class="visually-hidden">up</span> 38%</span></span>
</div>
<div class="num">
<span class="label">Repeat purchase</span>
<span class="num-value">40%</span>
<span class="num-base">within 30 days · 31% in spring · <span class="delta"><span aria-hidden="true">▲</span><span class="visually-hidden">up</span> 9 pt</span></span>
</div>
</div>
</section>
<section class="section" aria-labelledby="weeks-h">
<h2 id="weeks-h">Week by week</h2>
<div class="body">
<p>New customers per week, first orders attributed as described under the channel table. The dashed line is the weekly average of the spring campaign, 755 new customers a week. From week 2 the autumn campaign never dropped below it.</p>
</div>
<figure class="chart wide">
<svg viewBox="0 0 760 400" role="img" aria-label="New customers per week, autumn 2026. Every week from week 2 beat the spring weekly average of 755. Week 6 peaked at 1,870 new customers after a creator post, 22 percent of the campaign total. Weekly values: 640, 790, 880, 950, 1,010, 1,870, 1,160, 1,010.">
<g class="c-legend">
<line x1="64" y1="26" x2="92" y2="26"/>
<text x="100" y="30">Spring weekly average, 755 new customers</text>
</g>
<g class="c-grid">
<line x1="64" y1="48" x2="740" y2="48"/>
<line x1="64" y1="118" x2="740" y2="118"/>
<line x1="64" y1="188" x2="740" y2="188"/>
<line x1="64" y1="258" x2="740" y2="258"/>
</g>
<g class="c-axis">
<text x="56" y="52">2,000</text>
<text x="56" y="122">1,500</text>
<text x="56" y="192">1,000</text>
<text x="56" y="262">500</text>
<text x="56" y="332">0</text>
</g>
<g class="c-bars">
<rect x="81" y="238.4" width="58" height="89.6"/>
<rect x="165" y="217.4" width="58" height="110.6"/>
<rect x="249" y="204.8" width="58" height="123.2"/>
<rect x="333" y="195" width="58" height="133"/>
<rect x="417" y="186.6" width="58" height="141.4"/>
<rect class="hi" x="501" y="66.2" width="58" height="261.8"/>
<rect x="585" y="165.6" width="58" height="162.4"/>
<rect x="669" y="186.6" width="58" height="141.4"/>
</g>
<line class="c-base" x1="64" y1="328" x2="740" y2="328"/>
<line class="c-spring" x1="64" y1="222.3" x2="740" y2="222.3"/>
<g class="c-val">
<text x="110" y="230">640</text>
<text x="194" y="209">790</text>
<text x="278" y="196">880</text>
<text x="362" y="187">950</text>
<text x="446" y="178">1,010</text>
<text class="hi" x="530" y="58">1,870</text>
<text x="614" y="157">1,160</text>
<text x="698" y="178">1,010</text>
</g>
<g class="c-week">
<text x="110" y="352">W1</text>
<text x="194" y="352">W2</text>
<text x="278" y="352">W3</text>
<text x="362" y="352">W4</text>
<text x="446" y="352">W5</text>
<text x="530" y="352">W6</text>
<text x="614" y="352">W7</text>
<text x="698" y="352">W8</text>
</g>
<g class="c-date">
<text x="110" y="372">1 Sep</text>
<text x="194" y="372">8 Sep</text>
<text x="278" y="372">15 Sep</text>
<text x="362" y="372">22 Sep</text>
<text x="446" y="372">29 Sep</text>
<text x="530" y="372">6 Oct</text>
<text x="614" y="372">13 Oct</text>
<text x="698" y="372">20 Oct</text>
</g>
<g class="c-note">
<rect x="580" y="72" width="164" height="62"/>
<line x1="559" y1="98" x2="580" y2="98"/>
<text class="hi" x="586" y="88">Creator post, 7 Oct,</text>
<text x="586" y="106">plus €6k moved behind it.</text>
<text x="586" y="124">22% of all new customers.</text>
</g>
</svg>
<figcaption><strong>Figure 1 · New customers per week against the spring weekly average.</strong> Week 6, highlighted, brought 1,870 new customers, 22% of the campaign total. One of the six creators posted an unscripted follow-up about her morning routine on Wednesday 7 October; it reached 640,000 people in four days and we moved €6,000 of paid social behind it within 48 hours. Week 1 is the only week below the spring line.</figcaption>
</figure>
</section>
<section class="section" aria-labelledby="money-h">
<h2 id="money-h">Where the money went</h2>
<div class="body">
<p>Five channels, one currency: the cost of a new customer. Creators were the cheapest paid customer of the campaign. Out-of-home took 17% of the spend and delivered 5% of the customers.</p>
</div>
<div class="wide">
<div class="table-scroll">
<table>
<caption>Spend and new customers by channel, weeks 1 to 8</caption>
<thead>
<tr>
<th scope="col">Channel</th>
<th scope="col" class="n">Spend</th>
<th scope="col" class="n">New customers</th>
<th scope="col" class="n">Share of customers</th>
<th scope="col" class="n">Cost per customer</th>
<th scope="col" class="n">Cost vs spring</th>
</tr>
</thead>
<tbody>
<tr>
<th scope="row">Paid social</th>
<td class="n">€52,000</td>
<td class="n">3,900</td>
<td class="n">47%</td>
<td class="n">€13.33</td>
<td class="n"><span aria-hidden="true">▼</span><span class="visually-hidden">down</span> 26%</td>
</tr>
<tr>
<th scope="row">Search</th>
<td class="n">€24,000</td>
<td class="n">1,850</td>
<td class="n">22%</td>
<td class="n">€12.97</td>
<td class="n"><span aria-hidden="true">▼</span><span class="visually-hidden">down</span> 8%</td>
</tr>
<tr>
<th scope="row">Creator</th>
<td class="n">€18,000</td>
<td class="n">1,540</td>
<td class="n">19%</td>
<td class="n">€11.69</td>
<td class="n"><span aria-hidden="true">▼</span><span class="visually-hidden">down</span> 40%</td>
</tr>
<tr>
<th scope="row">Email</th>
<td class="n">€4,000</td>
<td class="n">620</td>
<td class="n">7%</td>
<td class="n">€6.45</td>
<td class="n"><span aria-hidden="true">▼</span><span class="visually-hidden">down</span> 9%</td>
</tr>
<tr>
<th scope="row">Out-of-home</th>
<td class="n">€20,000</td>
<td class="n">400</td>
<td class="n">5%</td>
<td class="n">€50.00</td>
<td class="n"><span aria-hidden="true">▲</span><span class="visually-hidden">up</span> 8%</td>
</tr>
</tbody>
<tfoot>
<tr>
<th scope="row">Total</th>
<td class="n">€118,000</td>
<td class="n">8,310</td>
<td class="n">100%</td>
<td class="n">€14.20</td>
<td class="n"><span aria-hidden="true">▼</span><span class="visually-hidden">down</span> 22%</td>
</tr>
</tfoot>
</table>
</div>
<p class="table-note">Attribution: last paid touch within seven days for paid social and search; creator codes and links for creator; order-level for email, counting first orders from subscribers who had not bought before; post-purchase survey for out-of-home. Cost vs spring compares with the March–April 2026 campaign, same method.</p>
</div>
</section>
<section class="section" aria-labelledby="worked-h">
<h2 id="worked-h">What worked</h2>
<div class="body">
<ol class="points">
<li>
<div>
<h3>Creators beat every paid channel on cost</h3>
<p>Six creators, €18,000, 1,540 new customers at €11.69 each. The week-6 video was not in the brief: the creator posted a second, unscripted piece about her morning routine and it reached 640,000 people in four days. The two best-performing creator pieces of the campaign were both outside the shot list we gave them.</p>
</div>
</li>
<li>
<div>
<h3>Moving the budget every Monday</h3>
<p>We reviewed spend weekly and moved €7,000 between lines, out of out-of-home and brand search and into paid social and creators, plus a further €9,000 inside paid social from the “origin” creative set (2.4% click-through) to the “ritual” set (4.2%). Click-through stood at 2.6% at the end of week 2 and finished at 3.1%; the reallocation is most of the difference.</p>
</div>
</li>
<li>
<div>
<h3>Email did the repeat work</h3>
<p>The three-send “second bag” sequence, sent 5, 12 and 20 days after a first order, cost €4,000 and lifted repeat purchase within 30 days from 31% to 40%. It is the reason the +9 pt sits next to the acquisition numbers rather than behind them.</p>
</div>
</li>
</ol>
</div>
</section>
<section class="section" aria-labelledby="missed-h">
<h2 id="missed-h">What did not</h2>
<div class="body">
<ol class="points">
<li>
<div>
<h3>Out-of-home did not pay back</h3>
<p>€20,000 across three cities in two flights; we cancelled the third. By post-purchase survey, 400 new customers named the posters as where they first saw Marlow: €50 per customer, 3.5 times the blended figure, on the weakest attribution in the table. We do not recommend out-of-home again at this scale, and bet 3 below is the small test that would settle it.</p>
</div>
</li>
<li>
<div>
<h3>Week 1 underperformed, and that is on us</h3>
<p>640 new customers, below the spring weekly average of 755. The landing page shipped three days late and the first two creatives went live without a test; the “origin” set opened at 2.1% click-through. Our estimate is around 300 customers lost, most of them in the first four days.</p>
</div>
</li>
</ol>
</div>
</section>
<section class="section" aria-labelledby="learned-h">
<h2 id="learned-h">What we learned</h2>
<div class="body grow">
<ul class="learn">
<li><strong>Creative choice moved results more than bidding.</strong> Between the two creative sets, click-through differed by 1.8 pt. No bid or audience change during the eight weeks moved it by more than 0.3 pt.</li>
<li><strong>Brief the ritual, not the shot list.</strong> Both breakout creator pieces were unscripted. The winter brief should describe the morning we want people to recognise and leave the framing to the creator.</li>
<li><strong>The offer mattered less than the hour.</strong> “First bag €9” and “free shipping on the first three bags” performed within 4% of each other. Posts published between 06:00 and 08:00 outperformed the same creative published after 17:00 by 31% on click-through.</li>
<li><strong>Attribution is now the weakest part of the setup.</strong> Paid social, search and email numbers are defensible. Creator and out-of-home rest on codes and a one-question survey that 4,900 of the 8,310 new customers answered. Bet 3 includes a tracked offer for that reason.</li>
</ul>
</div>
</section>
<section class="section" aria-labelledby="bets-h">
<h2 id="bets-h">Next bets</h2>
<div class="body">
<p>Three proposals for the winter campaign, each with a cost, the effect we expect, and the rule we would use to stop it.</p>
</div>
<div class="wide">
<div class="table-scroll">
<table>
<caption>Proposed bets for winter 2026 to 2027</caption>
<thead>
<tr>
<th scope="col">Bet</th>
<th scope="col" class="n">Cost</th>
<th scope="col">Expected effect</th>
<th scope="col">Decision rule</th>
</tr>
</thead>
<tbody>
<tr>
<th scope="row" class="txt">1 · Twelve creators for winter, up from six, briefed on the ritual</th>
<td class="n">€36,000</td>
<td class="txt">About 3,000 new customers at €13 or less each, and two more posts of week-6 scale</td>
<td class="txt">Continue only if cost per customer is under €15 at the end of week 4</td>
</tr>
<tr>
<th scope="row" class="txt">2 · Always-on “second bag” sequence, email plus SMS</th>
<td class="n">€6,000</td>
<td class="txt">Repeat purchase within 30 days from 40% to 44%; cost covers the build and three months of sends</td>
<td class="txt">Drop the SMS leg if unsubscribes exceed 1.5% on any send</td>
</tr>
<tr>
<th scope="row" class="txt">3 · One out-of-home format only: station panels near the two Marlow cafés, with a QR-tracked offer</th>
<td class="n">€8,000</td>
<td class="txt">A clean read on whether out-of-home can reach €25 per customer, with attribution we can defend</td>
<td class="txt">Remove out-of-home from 2027 plans if it lands above €25</td>
</tr>
</tbody>
</table>
</div>
</div>
</section>
<section class="section" aria-labelledby="budget-h">
<h2 id="budget-h">Budget against spend</h2>
<div class="body">
<p>€118,000 spent of €120,000. The variances are the Monday reallocations described above; contingency covered €1,000 of the creator top-up and the rest was not needed.</p>
</div>
<div class="wide">
<div class="table-scroll">
<table>
<caption>Budget and spend by line, media and creator fees excluding VAT</caption>
<thead>
<tr>
<th scope="col">Line</th>
<th scope="col" class="n">Budget</th>
<th scope="col" class="n">Spend</th>
<th scope="col" class="n">Variance</th>
<th scope="col">Why</th>
</tr>
</thead>
<tbody>
<tr>
<th scope="row">Paid social</th>
<td class="n">€48,000</td>
<td class="n">€52,000</td>
<td class="n">+€4,000</td>
<td class="why">Reallocated from out-of-home in weeks 5 to 8, behind the “ritual” set and the week-6 creator post</td>
</tr>
<tr>
<th scope="row">Search</th>
<td class="n">€26,000</td>
<td class="n">€24,000</td>
<td class="n">−€2,000</td>
<td class="why">Brand terms capped from week 4; 70% of brand clicks came from people who had already bought</td>
</tr>
<tr>
<th scope="row">Creator</th>
<td class="n">€15,000</td>
<td class="n">€18,000</td>
<td class="n">+€3,000</td>
<td class="why">Two creators added in week 3, and usage rights for the week-6 video</td>
</tr>
<tr>
<th scope="row">Email</th>
<td class="n">€4,000</td>
<td class="n">€4,000</td>
<td class="n">€0</td>
<td class="why">As planned</td>
</tr>
<tr>
<th scope="row">Out-of-home</th>
<td class="n">€24,000</td>
<td class="n">€20,000</td>
<td class="n">−€4,000</td>
<td class="why">Third flight in week 7 cancelled</td>
</tr>
<tr>
<th scope="row">Contingency</th>
<td class="n">€3,000</td>
<td class="n">€0</td>
<td class="n">−€3,000</td>
<td class="why">€1,000 released to the creator line; €2,000 unspent</td>
</tr>
</tbody>
<tfoot>
<tr>
<th scope="row">Total</th>
<td class="n">€120,000</td>
<td class="n">€118,000</td>
<td class="n">−€2,000</td>
<td class="why">98.3% of budget spent</td>
</tr>
</tfoot>
</table>
</div>
</div>
</section>
<section class="section" aria-labelledby="notes-h">
<h2 id="notes-h">Notes on the numbers</h2>
<div class="body grow">
<ul class="notes">
<li><strong>Window.</strong> 1 September – 26 October 2026, with a seven-day attribution tail to 2 November. Spring comparison: 2 March – 26 April 2026, same method.</li>
<li><strong>Click-through.</strong> 189,000 clicks on 6.1 million paid impressions across paid social, search, creator and email. Spring: 103,000 clicks on 4.7 million impressions.</li>
<li><strong>Reach.</strong> De-duplicated people across the four digital channels, from platform reporting. The out-of-home audience is estimated by the media owner and is not included.</li>
<li><strong>New customers.</strong> First orders in Marlow’s order export, matched to a channel as described under the channel table.</li>
<li><strong>Repeat purchase.</strong> Share of new customers who ordered again within 30 days. Measured on weeks 1 to 4 customers (3,260) against the same window in spring; weeks 5 to 8 will be added in the December update.</li>
<li><strong>Money.</strong> Media and creator fees, excluding VAT. The Oaken & Pike retainer is billed separately and is not part of the €118,000.</li>
</ul>
</div>
</section>
<footer class="foot">
<span class="wordmark">Oaken <span class="amp">&</span> Pike</span>
<span>Marlow Coffee · Autumn 2026 campaign recap · Version 1.0 · 3 November 2026</span>
</footer>
</div>
</body>
</html>
The recap that says what happened before the client asks. One headline result, the five numbers behind it, a weekly chart with the spike explained, and an honest "what did not work" section, because the next bet depends on it.
The sample is Oaken & Pike, a fictional agency, recapping an autumn campaign for a fictional coffee brand. The structure fits any paid or content campaign.
Headline result, key numbers, weekly chart, channel table, what worked, what did not, learnings, next bets, and budget versus spend. Inline CSS and SVG, no scripts.
More templates
A security assessment report in one HTML file – executive summary with severity counts, scope and method, findings with evidence and fixes, a 30-day plan, and an appendix. Duplicate it, or hand the prompt to your agent.
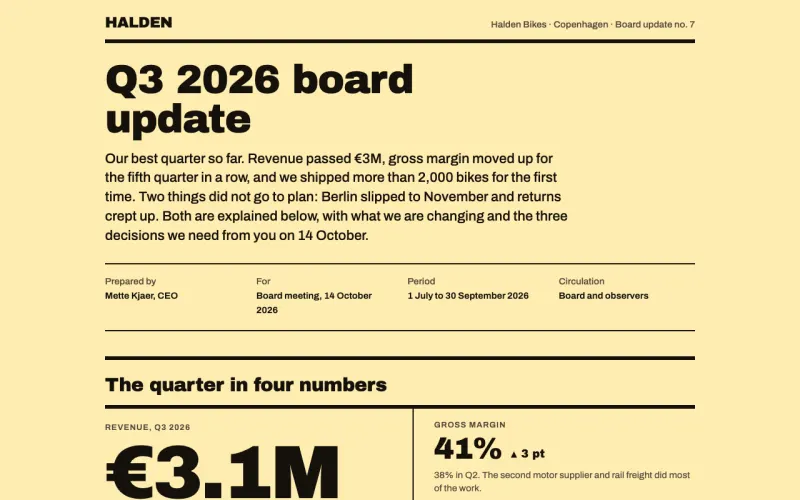
A quarterly board update in one HTML page – headline numbers, what went well and what did not, a revenue chart, hiring and risk tables, and the decisions you need. Duplicate it, or hand the prompt to your agent.
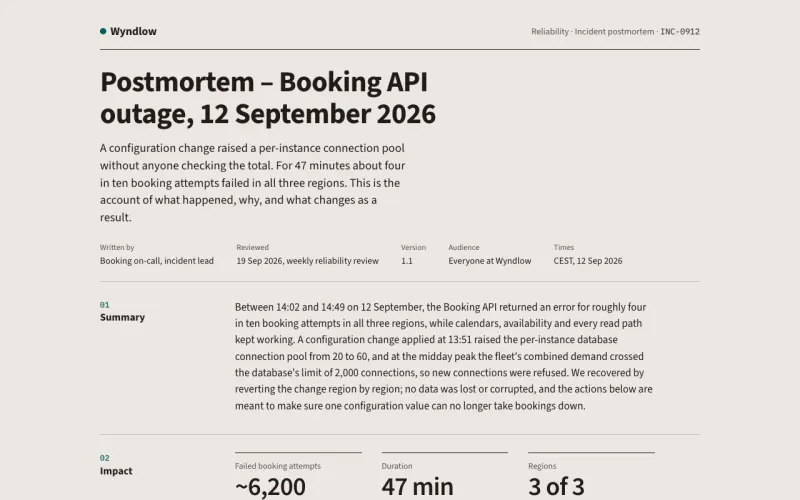
A blameless postmortem in one HTML page – summary, impact, a timestamped timeline, root cause, contributing factors, what went well and badly, and owned action items. Duplicate it, or hand the prompt to your agent.
Any agent, any model. Behind your company’s sign-in, at one flat price.
Free to start · Unlimited viewers